 | Info
Sheets |
| | | | | | | | | | | | | | | | | | | | | | | | |
 | Out-
side |
| | | | |
|
| | | | | |  | Searchterm 'T2' was also found in the following services: | | | | |
|  |  |
| |
|


O-scan is manufactured and distributed by Esaote SpA
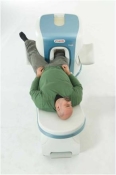
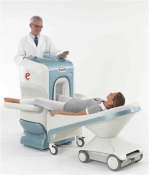
O-scan is a compact, dedicated extremity MRI system designed for easy installation and high throughput. The complete system fits in a 9' x 10' room, doesn't need for RF or magnetic shielding and it plugs in the wall. The 0.31T permanent magnet along with dual phased array RF coils, and advanced imaging protocols provide outstanding image quality and fast 25 minute complete examinations.
Esaote North America is the exclusive distributor of the O-scan system in the USA.
Device Information and Specification CLINICAL APPLICATION Dedicated Extremity
PULSE SEQUENCES
SE, HSE, HFE, GE, 2dGE, ME, IR, STIR, Stir T2, GESTIR, TSE, TME, FSE STIR, FSE ( T1, T2), X-Bone, Turbo 3DT1, 3D SHARC, 3D SST1, 3D SS T22D: 2mm - 10 mm, 3D: 0.6 - 10 mm POWER REQUIREMENTS 100/110/200/220/230/240 | |  | | | |
|  | |  |  |  |
| |
|
Signal intensity interpretation in MR imaging has a major problem.
Often there is no intuitive approach to signal behavior as signal intensity is a very complicated function of the contrast-determining tissue parameter, proton density, T1 and T2, and the machine parameters TR and TE. For this reason, the terms T1 weighted image, T2 weighted image and proton density weighted image were introduced into clinical MR imaging.
Air and bone produce low-intensity, weaker signals with darker images. Fat and marrow produce high-intensity signals with brighter images.
The signal intensity measured is related to the square of the xy-magnetization, which in a SE pulse sequence is given by
Mxy = Mxy0(1-exp(-TR/T1)) exp(-TE/ T2) (1)
where Mxy0 = Mz0 is proportional to the proton or spin density, and corresponds to the z-magnetization present at zero time of the experiment when it is tilted into the xy-plane. See also T2 Weighted Image and Ernst Angle. | |  | |
• View the DATABASE results for 'Signal Intensity' (56).
| | |
• View the NEWS results for 'Signal Intensity' (1).
| | | | |  Further Reading: Further Reading: | | Basics:
|
|
News & More:
| |
| |
|  | |  |  |  |
| |
|

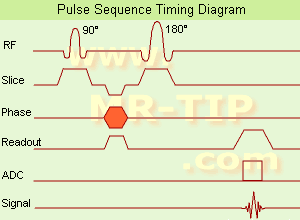
(SE) The most common pulse sequence used in MR imaging is based of the detection of a spin or Hahn echo. It uses 90° radio frequency pulses to excite the magnetization and one or more 180° pulses to refocus the spins to generate signal echoes named spin echoes (SE).
In the pulse sequence timing diagram, the simplest form of a spin echo sequence is illustrated.
The 90° excitation pulse rotates the longitudinal magnetization ( Mz) into the xy-plane and the dephasing of the transverse magnetization (Mxy) starts.
The following application of a 180° refocusing pulse (rotates the magnetization in the x-plane) generates signal echoes. The purpose of the 180° pulse is to rephase the spins, causing them to regain coherence and thereby to recover transverse magnetization, producing a spin echo.
The recovery of the z-magnetization occurs with the T1 relaxation time and typically at a much slower rate than the T2-decay, because in general T1 is greater than T2 for living tissues and is in the range of 100-2000 ms.
The SE pulse sequence was devised in the early days of NMR days by Carr and Purcell and exists now in many forms: the multi echo pulse sequence using single or multislice acquisition, the fast spin echo (FSE/TSE) pulse sequence, echo planar imaging (EPI) pulse sequence and the gradient and spin echo (GRASE) pulse sequence;; all are basically spin echo sequences.
In the simplest form of SE imaging, the pulse sequence has to be repeated as many times as the image has lines. Contrast values:
PD weighted: Short TE (20 ms) and long TR.
T1 weighted: Short TE (10-20 ms) and short TR (300-600 ms)
T2 weighted: Long TE (greater than 60 ms) and long TR (greater than 1600 ms)
With spin echo imaging no T2* occurs, caused by the 180° refocusing pulse. For this reason, spin echo sequences are more robust against e.g., susceptibility artifacts than gradient echo sequences.
See also Pulse Sequence Timing Diagram to find a description of the components.
| | | |  | |
• View the DATABASE results for 'Spin Echo Sequence' (24).
| | | | |  Further Reading: Further Reading: | | Basics:
|
|
News & More:
| |
| |
|  |  | Searchterm 'T2' was also found in the following services: | | | | |
|  |  |
| |
|
General MRI of the abdomen can consist of T1 or T2 weighted spin echo, fast spin echo ( FSE, TSE) or gradient echo sequences with fat suppression and contrast enhanced MRI techniques. The examined organs include liver, pancreas, spleen, kidneys, adrenals as well as parts of the stomach and intestine (see also gastrointestinal imaging). Respiratory compensation and breath hold imaging is mandatory for a good image quality.
T1 weighted sequences are more sensitive for lesion detection than T2 weighted sequences at 0.5 T, while higher field strengths (greater than 1.0 T), T2 weighted and spoiled gradient echo sequences are used for focal lesion detection.
Gradient echo in phase T1 breath hold can be performed as a dynamic series with the ability to visualize the blood distribution. Phases of contrast enhancement include the capillary or arterial dominant phase for demonstrating hypervascular lesions, in liver imaging the portal venous phase demonstrates the maximum difference between the liver and hypovascular lesions, while the equilibrium phase demonstrates interstitial disbursement for edematous and malignant tissues.
Out of phase gradient echo imaging for the abdomen is a lipid-type tissue sensitive sequence and is useful for the visualization of focal hepatic lesions, fatty liver (see also Dixon), hemochromatosis, adrenal lesions and renal masses.
The standards for abdominal MRI vary according to clinical sites based on sequence availability and MRI equipment.
Specific abdominal imaging coils and liver-specific contrast agents targeted to the healthy liver tissue improve the detection and localization of lesions.
See also Hepatobiliary Contrast Agents, Reticuloendothelial Contrast Agents, and Oral Contrast Agents.
For Ultrasound Imaging (USI) see Abdominal Ultrasound at Medical-Ultrasound-Imaging.com. | | | |  | |
• View the DATABASE results for 'Abdominal Imaging' (11).
| | |
• View the NEWS results for 'Abdominal Imaging' (3).
| | | | |  Further Reading: Further Reading: | Basics:
|
|
News & More:
|  |
Assessment of Female Pelvic Pathologies: A Cross-Sectional Study Among Patients Undergoing Magnetic Resonance Imaging for Pelvic Assessment at the Maternity and Children Hospital, Qassim Region, Saudi Arabia
Saturday, 7 October 2023 by www.cureus.com |  |  |
Higher Visceral, Subcutaneous Fat Levels Predict Brain Volume Loss in Midlife
Wednesday, 4 October 2023 by www.neurologyadvisor.com |  |  |
Deep Learning Helps Provide Accurate Kidney Volume Measurements
Tuesday, 27 September 2022 by www.rsna.org |  |  |
CT, MRI for pediatric pancreatitis interobserver agreement with INSPPIRE
Friday, 11 March 2022 by www.eurekalert.org |  |  |
Clinical trial: Using MRI for prostate cancer diagnosis equals or beats current standard
Thursday, 4 February 2021 by www.eurekalert.org |  |  |
Computer-aided detection and diagnosis for prostate cancer based on mono and multi-parametric MRI: A review - Abstract
Tuesday, 28 April 2015 by urotoday.com |  |  |
Nottingham scientists exploit MRI technology to assist in the treatment of IBS
Thursday, 9 January 2014 by www.news-medical.net |  |  |
New MR sequence helps radiologists more accurately evaluate abnormalities of the uterus and ovaries
Thursday, 23 April 2009 by www.eurekalert.org |  |  |
MRI identifies 'hidden' fat that puts adolescents at risk for disease
Tuesday, 27 February 2007 by www.eurekalert.org |
|
| |
|  | |  |  |  |
| |
|
(ADC) A diffusion coefficient to differentiate T2 shine through effects or artifacts from real ischemic lesions. In the human brain, water diffusion is a three-dimensional process that is not truly random because the diffusional motion of water is impeded by natural barriers. These barriers are cell membranes, myelin sheaths, white matter fiber tracts, and protein molecules.
The apparent water diffusion coefficients can be calculated by acquiring two or more images with a different gradient duration and amplitude (b-values). The contrast in the ADC map depends on the spatially distributed diffusion coefficient of the acquired tissues and does not contain T1 and T2* values.
The increased sensitivity of diffusion-weighted MRI in detecting acute ischemia is thought to be the result of the water shift intracellularly restricting motion of water protons (cytotoxic edema), whereas the conventional T2 weighted images show signal alteration mostly as a result of vasogenic edema.
The reduced ADC value also could be the result of decreased temperature in the nonperfused tissues, loss of brain pulsations leading to a decrease in apparent proton motion, increased tissue osmolality associated with ischemia, or a combination of these factors.
The lower ADC measurements seen with early ischemia, have not been fully established, however, a lower apparent ADC is a sensitive indicator of early ischemic brain at a stage when ischemic tissue remains potentially salvageable.
See also Diffusion Weighted Imaging and Diffusion Tensor Tractography. | |  | |
• View the DATABASE results for 'Apparent Diffusion Coefficient' (4).
| | | | |  Further Reading: Further Reading: | Basics:
|
|
News & More:
| |
| |
|  | |  |  |
|  | | |
|
| |
 | Look
Ups |
| |